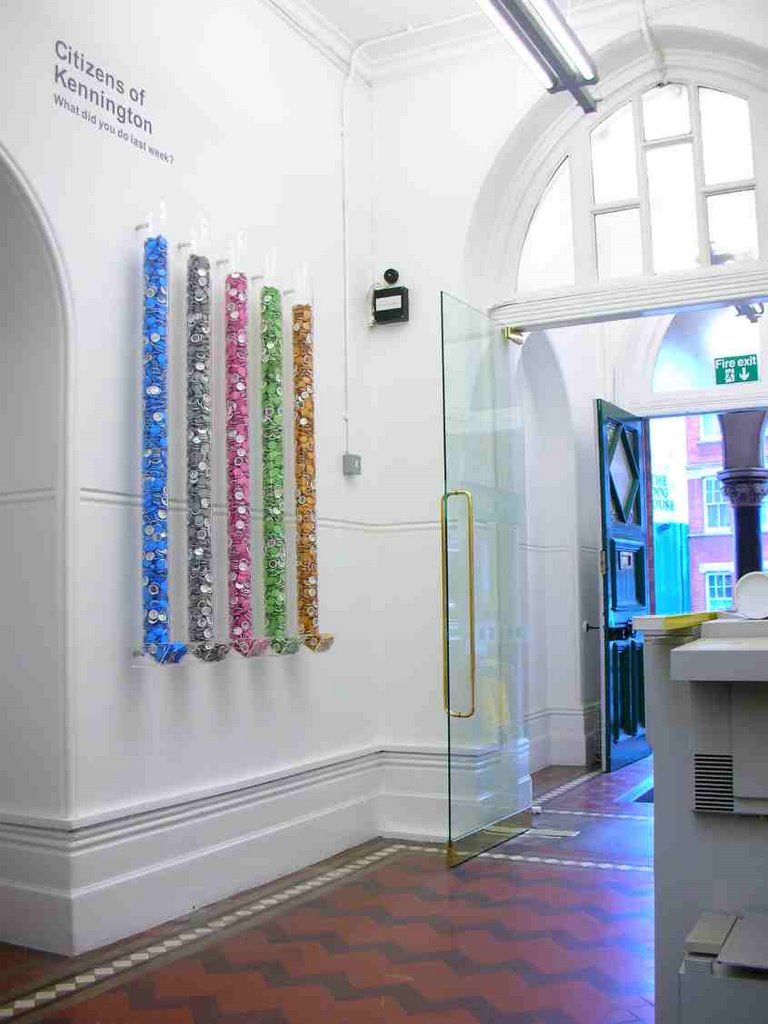
My project 'Physical Bar Charts' is currently installed in the Durning Library, a busy public library in south London, part of the group exhibition Day to Day Data, which opened on 10 March. It consists of five acrylic tubes mounted on the wall, each with a dispenser at the bottom. Each tube is filled initially with around 1500 button badges, of one colour, with a single printed message on. Over the course of the exhibition people can help themselves, the levels in the tubes drop and the reverse bar chart shows the varying levels of engagement of its passers-by.
Here's a picture before the general public was allowed to help themselves.
Pink "I did nothing"
Grey "I helped someone"
Green "I spoke up"
Blue "I made a stand"
Orange "I got by"

No comments:
Post a Comment